作成日: 2021/05/14 最終更新日: 2021/05/14
文書種別
使用方法
詳細
指定したX座標の位置に縦線を引くには、FlexChartの線注釈(Annotation.Lineクラス)の機能を使用します。
なお、日付データ(DateTime型)をX値として使用した場合、日付そのものを用いてX座標を指定することはできません。コントロール内部では、DateTime型の値をDouble型に変換(DateTime.ToOADateメソッドを使用)した値が保持されているためです。
このような場合、指定した日付をToOADateメソッドで変換した値をX座標として設定し、その位置に線注釈を描画します。
以下に、2日後の位置に縦線を描画するサンプルを記載します。
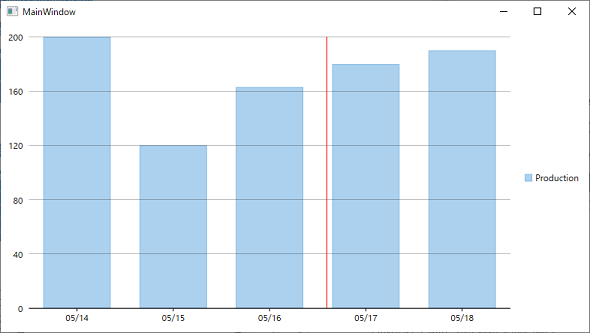
【XAML】
なお、日付データ(DateTime型)をX値として使用した場合、日付そのものを用いてX座標を指定することはできません。コントロール内部では、DateTime型の値をDouble型に変換(DateTime.ToOADateメソッドを使用)した値が保持されているためです。
このような場合、指定した日付をToOADateメソッドで変換した値をX座標として設定し、その位置に線注釈を描画します。
以下に、2日後の位置に縦線を描画するサンプルを記載します。
【XAML】
<Window
        xmlns="http://schemas.microsoft.com/winfx/2006/xaml/presentation"
        xmlns:x="http://schemas.microsoft.com/winfx/2006/xaml"
        xmlns:d="http://schemas.microsoft.com/expression/blend/2008"
        xmlns:mc="http://schemas.openxmlformats.org/markup-compatibility/2006"
        xmlns:local="clr-namespace:FlexChartLine"
        xmlns:c1="http://schemas.componentone.com/winfx/2006/xaml" x:Class="FlexChartLine.MainWindow"
        mc:Ignorable="d"
        Title="MainWindow" Height="450" Width="800">
    <Grid>
        <c1:C1FlexChart x:Name="flexChart" >
        </c1:C1FlexChart>
    </Grid>
</Window>using C1.Chart;
using C1.WPF.Chart;
using C1.WPF.Chart.Annotation;
using System;
using System.Collections.Generic;
using System.Linq;
using System.Windows;
using System.Windows.Media;
namespace FlexChartLine
{
public partial class MainWindow : Window
{
AnnotationLayer annotationLayer;
public MainWindow()
{
InitializeComponent();
flexChart.ItemsSource = GetSampleData();
flexChart.Binding = "Quantity";
flexChart.ChartType = ChartType.Column;
var series = new Series()
{
SeriesName = "Production",
BindingX = "Date"
};
flexChart.Series.Add(series);
flexChart.AxisX.Format = "MM/dd";
annotationLayer = new AnnotationLayer();
flexChart.Layers.Add(annotationLayer);
bool lineAdded = false;
flexChart.Rendering += (s, e) =>
{
if (!lineAdded)
{
AddLine(DateTime.Now.AddDays(2));
lineAdded = true;
}
};
}
private void AddLine(DateTime date)
{
annotationLayer.Annotations.Add(new C1.WPF.Chart.Annotation.Line()
{
Attachment = C1.Chart.Annotation.AnnotationAttachment.DataCoordinate,
Start = new Point(date.ToOADate(), flexChart.AxisY.ConvertBack(flexChart.PlotRect.Bottom)),
End = new Point(date.ToOADate(), flexChart.AxisY.ConvertBack(flexChart.PlotRect.Top)),
Style = new ChartStyle() { Stroke = Brushes.Red, StrokeThickness = 1 }
});
}
public List<DataItem> GetSampleData()
{
return new List<DataItem>()
{
new DataItem(){ Date = DateTime.Today, Quantity = 200},
new DataItem(){ Date = DateTime.Today.AddDays(1), Quantity = 120},
new DataItem(){ Date = DateTime.Today.AddDays(2), Quantity = 163},
new DataItem(){ Date = DateTime.Today.AddDays(3), Quantity = 180},
new DataItem(){ Date = DateTime.Today.AddDays(4), Quantity = 190},
};
}
}
public class DataItem
{
public DateTime Date { get; set; }
public double Quantity { get; set; }
}
}