作成日: 2022/01/27 最終更新日: 2022/01/27
文書種別
使用方法
詳細
注釈がクリックされたときに発生する専用のイベントは、FlexChartには用意されていません。
ただし、FlexGrid for WinFormsなどと同様に、FlexChartはHitTestメソッドを用いたヒットテストをサポートし、実行時にコントロールの特定ポイントの情報を取得できるので、MouseDownイベント等を使用してHitTestメソッドでマウスポインタの位置を判別し、注釈上にある場合は、そのテキストや位置を変更するといった対応が可能です。
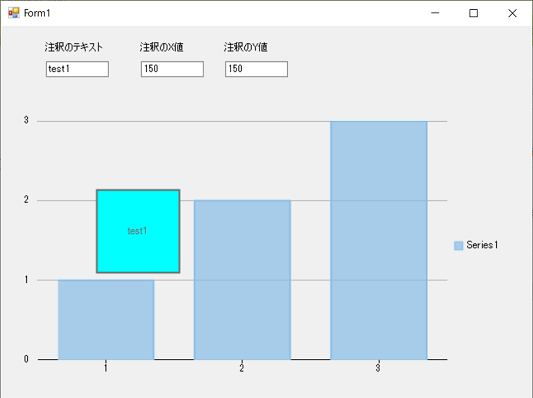
以下に、マウスで矩形注釈をクリックした時に、TextBoxの入力値に応じてテキストと位置を変更する簡単な例を記載します。
◎サンプルコード(VB)
ただし、FlexGrid for WinFormsなどと同様に、FlexChartはHitTestメソッドを用いたヒットテストをサポートし、実行時にコントロールの特定ポイントの情報を取得できるので、MouseDownイベント等を使用してHitTestメソッドでマウスポインタの位置を判別し、注釈上にある場合は、そのテキストや位置を変更するといった対応が可能です。
以下に、マウスで矩形注釈をクリックした時に、TextBoxの入力値に応じてテキストと位置を変更する簡単な例を記載します。
◎サンプルコード(VB)
Imports C1.Chart
Imports C1.Chart.Annotation
Imports C1.Win.Chart
Imports C1.Win.Chart.Annotation

Public Class Form1
    Dim annotationLayer As AnnotationLayer
    Dim annoRect As System.Drawing.Rectangle

    Private Sub Form1_Load(sender As Object, e As EventArgs) Handles MyBase.Load
        ' シリーズの作成
        Dim series1 As Series = New Series()
        With series1
            .Name = "Series1"
            .ChartType = ChartType.Column
            .Binding = "Y"
            .BindingX = "X"
            .DataSource = New PointF() {New PointF(1, 1), New PointF(2, 2), New PointF(3, 3)}
        End With

        ' チャートの設定
        FlexChart1.Series.Clear()
        FlexChart1.Series.Add(series1)

        ' 矩形注釈の作成と設定
        Dim annotation1 As Rectangle = New C1.Win.Chart.Annotation.Rectangle("test1")
        With annotation1
            .Attachment = AnnotationAttachment.Absolute
            .Location = New PointF(150.0F, 150.0F)
            .Width = 100
            .Height = 100
        End With
        annotation1.Style.FillColor = Color.Aqua
        AnnotationLayer = New AnnotationLayer(FlexChart1)
        annotationLayer.Annotations.Add(annotation1)

        ' 矩形注釈情報の取得
        Dim width As Integer = CType(annotation1.Width, Integer)
        Dim height As Integer = CType(annotation1.Height, Integer)
        Dim x As Integer = CType((annotation1.Location.X - (width / 2)), Integer)
        Dim y As Integer = CType((annotation1.Location.Y - (height / 2)), Integer)
        annoRect = UpdateAnnoInfo(annotation1)

        ' 取得情報をテキストボックスに設定
        textBox1.Text = annotation1.Content
        textBox2.Text = annotation1.Location.X.ToString
        textBox3.Text = annotation1.Location.Y.ToString
    End Sub

    Private Sub FlexChart1_MouseDown(sender As Object, e As MouseEventArgs) Handles FlexChart1.MouseDown
        ' マウスポインタ位置の要素確認
        Dim htInfo As HitTestInfo = CType(sender, FlexChart).HitTest(e.Location)
        ' マウスポインタが矩形注釈上にある場合
        If annoRect.Contains(e.Location) Then
            ' 矩形注釈の変更:textBoxの内容に応じて、テキストおよび位置を変更します
            Dim anno1 = CType(annotationLayer.Annotations(0), C1.Win.Chart.Annotation.Rectangle)
            anno1.Content = textBox1.Text
            anno1.Location = New Point(Integer.Parse(textBox2.Text), Integer.Parse(textBox3.Text))
            ' 矩形注釈情報の更新
            annoRect = UpdateAnnoInfo(anno1)
        Else
            'マウスポインタが矩形注釈上にない場合
            MessageBox.Show("矩形注釈ではありません")
        End If
    End Sub

    ' 矩形注釈のSystem.Drawing.Rectangleの取得
    Private Function UpdateAnnoInfo(ByVal anno As C1.Win.Chart.Annotation.Rectangle) As System.Drawing.Rectangle
        Dim width As Integer = CType(anno.Width, Integer)
        Dim height As Integer = CType(anno.Height, Integer)
        Dim x As Integer = CType((anno.Location.X - (width / 2)), Integer)
        Dim y As Integer = CType((anno.Location.Y - (height / 2)), Integer)
        Return New System.Drawing.Rectangle(x, y, width, height)
    End Function
End Classusing System;
using System.Drawing;
using System.Windows.Forms;
using C1.Chart;
using C1.Chart.Annotation;
using C1.Win.Chart;
using C1.Win.Chart.Annotation;
namespace _20210702a
{
public partial class Form1 : Form
{
private AnnotationLayer annotationLayer;
private System.Drawing.Rectangle annoRect;
public Form1()
{
InitializeComponent();
}
private void Form1_Load(object sender, EventArgs e)
{
// シリーズの作成
var series1 = new Series()
{
Name = "Series1",
ChartType = ChartType.Column,
Binding = "Y",
BindingX = "X",
DataSource = new PointF[] { new PointF(1, 1), new PointF(2, 2), new PointF(3, 3) }
};
// チャートの設定
flexChart1.Series.Clear();
flexChart1.Series.Add(series1);
// 矩形注釈の作成と設定
var annotation1 = new C1.Win.Chart.Annotation.Rectangle("test1")
{
Attachment = AnnotationAttachment.Absolute,
Location = new PointF(150.0F, 150.0F),
Width = 100,
Height = 100
};
annotation1.Style.FillColor = Color.Aqua;
annotationLayer = new AnnotationLayer(flexChart1);
annotationLayer.Annotations.Add(annotation1);
// 矩形注釈情報の取得
var width = (int)annotation1.Width;
var height = (int)annotation1.Height;
var x = (int)(annotation1.Location.X - width / 2);
var y = (int)(annotation1.Location.Y - height / 2);
annoRect = UpdateAnnoInfo(annotation1);
// 取得情報をテキストボックスに設定
textBox1.Text = annotation1.Content;
textBox2.Text = annotation1.Location.X.ToString();
textBox3.Text = annotation1.Location.Y.ToString();
}
private void flexChart1_MouseDown(object sender, MouseEventArgs e)
{
// マウスポインタ位置の要素確認
var htInfo = (sender as FlexChart).HitTest(e.Location);
// マウスポインタが矩形注釈上にある場合
if (annoRect.Contains(e.Location))
{
// 矩形注釈の変更:textBoxの内容に応じて、テキストおよび位置を変更します
var anno1 = annotationLayer.Annotations[0] as C1.Win.Chart.Annotation.Rectangle;
anno1.Content = textBox1.Text;
anno1.Location = new Point(int.Parse(textBox2.Text), int.Parse(textBox3.Text));
// 矩形注釈情報の更新
annoRect = UpdateAnnoInfo(anno1);
}
else
{
// マウスポインタが矩形注釈上にない場合
MessageBox.Show("矩形注釈ではありません");
}
}
// 矩形注釈のSystem.Drawing.Rectangleの取得
private System.Drawing.Rectangle UpdateAnnoInfo(C1.Win.Chart.Annotation.Rectangle anno)
{
var width = (int)anno.Width;
var height = (int)anno.Height;
var x = (int)(anno.Location.X - width / 2);
var y = (int)(anno.Location.Y - height / 2);
return new System.Drawing.Rectangle(x, y, width, height);
}
}
}