作成日: 2022/05/27 最終更新日: 2022/05/27
文書種別
使用方法
詳細
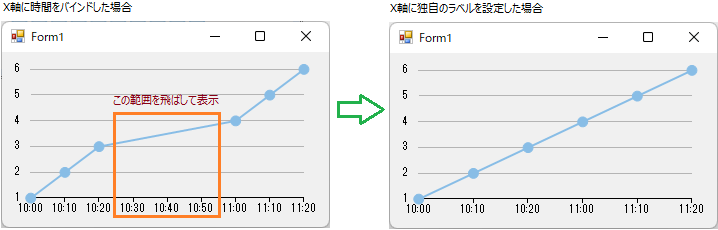
X値をDateTime型にして時間表示にしたとき、時間が連続しないデータ点は離れて描画されます。
表示の空いた区間をなくし、データ点を連続して表示させるため、X値を連続した整数値にバインドし、時間形式の文字列を独自ラベルとしてX軸に設定する方法が考えられます。
以下に簡単な設定例を記載します。
※ここでは、整数型とDateTime型を持つ独自クラスを作成して、データバインドしています。
◎サンプルコード(VB)
表示の空いた区間をなくし、データ点を連続して表示させるため、X値を連続した整数値にバインドし、時間形式の文字列を独自ラベルとしてX軸に設定する方法が考えられます。
以下に簡単な設定例を記載します。
※ここでは、整数型とDateTime型を持つ独自クラスを作成して、データバインドしています。
◎サンプルコード(VB)
Imports C1.Chart
Imports C1.Win.Chart

Public Class Form1
    Private Sub Form1_Load(sender As Object, e As EventArgs) Handles MyBase.Load
        ' データの作成
        Dim data = New List(Of Data)()
        data.Add(New Data(0, New DateTime(2022, 1, 1, 10, 0, 0), 1))
        data.Add(New Data(1, New DateTime(2022, 1, 1, 10, 10, 0), 2))
        data.Add(New Data(2, New DateTime(2022, 1, 1, 10, 20, 0), 3))
        data.Add(New Data(3, New DateTime(2022, 1, 1, 11, 0, 0), 4))
        data.Add(New Data(4, New DateTime(2022, 1, 1, 11, 10, 0), 5))
        data.Add(New Data(5, New DateTime(2022, 1, 1, 11, 20, 0), 6))

        ' チャートの設定
        UpdateView(data)
    End Sub

    Private Sub UpdateView(ByVal data As List(Of Data))
        ' 折れ線グラフの作成
        Dim series1 As Series = New Series() With {
            .Name = "series1",
            .ChartType = ChartType.LineSymbols,
            .DataSource = data,
            .Binding = "Value",
            .BindingX = "Index"
        }
        ' .BindingX = "DateTime"  '時間にバインド
        ' .BindingX = "Index"     '整数にバインド

        FlexChart1.Series.Clear()
        FlexChart1.Series.Add(series1)

        ' 独自のX軸ラベルを設定
        Dim xLabels = New List(Of KeyValuePair(Of Integer, String))()
        For i = 0 To data.Count - 1
            xLabels.Add(New KeyValuePair(Of Integer, String)(data(i).Index, data(i).DateTime.ToString("HH:mm")))
        Next
        FlexChart1.AxisX.DataSource = xLabels
        FlexChart1.AxisX.Binding = "Key,Value"
        FlexChart1.Legend.Position = Position.None
    End Sub

    Public Class Data
        Public Property Index As Integer
        Public Property DateTime As DateTime
        Public Property Value As Double

        Public Sub New(ByVal _index As Integer, ByVal _dateTime As DateTime, ByVal _value As Double)
            Index = _index
            DateTime = _dateTime
            Value = _value
        End Sub
    End Class
End Classusing C1.Chart;
using C1.Win.Chart;
namespace prj_FlexChart
{
public partial class Form1 : Form
{
public Form1()
{
InitializeComponent();
// データの作成
var data = new List();
data.Add(new Data(0,new DateTime(2022, 1, 1, 10, 0, 0), 1));
data.Add(new Data(1,new DateTime(2022, 1, 1, 10, 10, 0), 2));
data.Add(new Data(2, new DateTime(2022, 1, 1, 10, 20, 0), 3));
data.Add(new Data(3,new DateTime(2022, 1, 1, 11, 0, 0), 4));
data.Add(new Data(4,new DateTime(2022, 1, 1, 11, 10, 0), 5));
data.Add(new Data(5,new DateTime(2022, 1, 1, 11, 20, 0), 6));
// チャートの設定
UpdateView(data);
}
private void UpdateView(List data)
{
// 折れ線グラフの作成
Series series1 = new Series()
{
Name = "series1",
ChartType = ChartType.LineSymbols,
DataSource = data,
Binding = nameof(Data.Value),
//BindingX = nameof(Data.DateTime), //時間にバインド
BindingX = nameof(Data.Index), //整数にバインド
};
flexChart1.Series.Clear();
flexChart1.Series.Add(series1);
// 独自のX軸ラベルを設定
var xLabels = new List<KeyValuePair<int, String>>();
for (var i = 0; i < data.Count; i++)
{
xLabels.Add(new KeyValuePair<int, string>(data[i].Index, data[i].DateTime.ToString("HH:mm")));
}
flexChart1.AxisX.DataSource = xLabels;
flexChart1.AxisX.Binding = "Key,Value";
//凡例を非表示
flexChart1.Legend.Position = Position.None;
}
// データを保持するクラス
public class Data
{
public int Index { get; set; }
public DateTime DateTime { get; set; }
public double Value { get; set; }
public Data(int index, DateTime dateTime, double value)
{
Index = index;
DateTime = dateTime;
Value = value;
}
}
}
}