作成日: 2022/06/07 最終更新日: 2022/06/07
文書種別
使用方法
詳細
FlexChartの「注釈」機能を使うと、グラフのデータ点に対する吹き出しやコメントを追加して有益な情報を表示することができます。注釈として、テキスト、図形、画像などのオブジェクトを追加できます。
以下に、Polygonクラスを使用して「吹き出し線+矩形」の図形注釈を、Annotation.Imageクラスを使用して「矢印」の画像注釈を、グラフのデータ点にそれぞれ追加するサンプルコードを記載します。
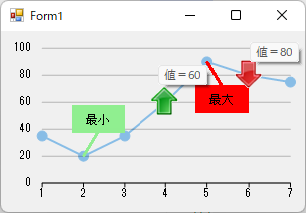
◎サンプルコード(C#)
以下に、Polygonクラスを使用して「吹き出し線+矩形」の図形注釈を、Annotation.Imageクラスを使用して「矢印」の画像注釈を、グラフのデータ点にそれぞれ追加するサンプルコードを記載します。
◎サンプルコード(C#)
using C1.Chart;
using C1.Win.Chart;
using C1.Chart.Annotation;
using C1.Win.Chart.Annotation;

namespace prj_C1FlexChart
{
    public partial class Form1 : Form
    {
        IRenderEngine _engine;
        AnnotationLayer annotationLayer1;

        public Form1()
        {
            InitializeComponent();

            // アノテーションレイヤーの追加
            annotationLayer1 = new AnnotationLayer(flexChart1);
        }

        private void Form1_Load(object sender, EventArgs e)
        {
            // グラフの作成
            Series series1 = new Series();
            series1.ChartType = C1.Chart.ChartType.LineSymbols;
            series1.DataSource = new PointF[] { new PointF(1, 35), new PointF(2, 20), new PointF(3, 35), new PointF(4, 60), new PointF(5, 90), new PointF(6, 80), new PointF(7, 75) };
            series1.Binding = "Y";
            series1.BindingX = "X";

            flexChart1.Series.Clear();
            flexChart1.Series.Add(series1);
            flexChart1.AxisY.Min = 0;
            flexChart1.AxisY.Max = 100;
        }

        private void flexChart1_Rendered(object sender, RenderEventArgs e)
        {
            _engine = e.Engine;

            // 吹き出し線と矩形の追加
            var lineCallout = new Polygon("最大")
            {
                Attachment = AnnotationAttachment.DataIndex,
                SeriesIndex = 0,
                PointIndex = 4,
                ContentCenter = new Point(15, 40),
                Points = { new Point(0, 0), new Point(15, 25), new Point(-10, 25), new Point(-10, 50), new Point(40, 50), new Point(40, 25), new Point(15, 25) }
            };
            lineCallout.ContentStyle.StrokeColor = Color.Black;
            lineCallout.Style.FillColor = Color.FromArgb(200, Color.Red);
            lineCallout.Style.StrokeColor = Color.Red;
            annotationLayer1.Annotations.Add(lineCallout);

            var arrowCallout = new Polygon("最小")
            {
                Attachment = AnnotationAttachment.DataIndex,
                SeriesIndex = 0,
                PointIndex = 1,
                ContentCenter = new PointF(15, -35),
                Points = { new Point(0, 0), new Point(15, -25), new Point(-10, -25), new Point(-10, -50), new Point(40, -50), new Point(40, -25), new Point(15, -25) }
            };
            arrowCallout.ContentStyle.StrokeColor = Color.Black;
            arrowCallout.Style.FillColor = Color.FromArgb(200, Color.LightGreen);
            arrowCallout.Style.StrokeColor = Color.LightGreen;
            annotationLayer1.Annotations.Add(arrowCallout);


            // 矢印画像の追加
            annotationLayer1.Annotations.Add(new C1.Win.Chart.Annotation.Image(Properties.Resources.arrowUP)
            {
                SeriesIndex = 0,
                PointIndex = 3,
                Attachment = AnnotationAttachment.DataIndex,
                TooltipText = "値=60"
            });
            annotationLayer1.Annotations.Add(new C1.Win.Chart.Annotation.Image(Properties.Resources.arrowDOWN)
            {
                SeriesIndex = 0,
                PointIndex = 5,
                Attachment = AnnotationAttachment.DataIndex,
                TooltipText = "値=80"
            });
        }
    }
}