作成日: 2023/12/15 最終更新日: 2023/12/15
文書種別
使用方法
詳細
FlexChartで箱ひげ図を描画するには、箱ひげ図の系列作成用のBoxWhiskerクラスを使用します。
まず、このクラスの新規インスタンスを作成して、箱ひげ図に固有の各種プロパティ(*)を設定し、FlexChartのSeriesに追加します。
*QuartileCalculation、ShowOutliers、ShowInnerPoints、ShowMeanLineなど
次いで、同じX値に対して複数のY値データを設定すると、内部的に箱ひげ図の四分位数、中央値などが計算され、箱ひげ図が描画されます。
以下に、2つの系列を持つ箱ひげ図を作成する簡単な設定コードを記載します。
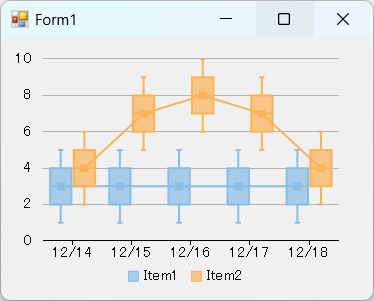
◎サンプルコード(VB)
まず、このクラスの新規インスタンスを作成して、箱ひげ図に固有の各種プロパティ(*)を設定し、FlexChartのSeriesに追加します。
*QuartileCalculation、ShowOutliers、ShowInnerPoints、ShowMeanLineなど
次いで、同じX値に対して複数のY値データを設定すると、内部的に箱ひげ図の四分位数、中央値などが計算され、箱ひげ図が描画されます。
以下に、2つの系列を持つ箱ひげ図を作成する簡単な設定コードを記載します。
◎サンプルコード(VB)
Imports C1.Chart
Imports C1.Win.Chart

Public Class Form1
    Private Sub Form1_Load(sender As Object, e As EventArgs) Handles MyBase.Load
        ' データの作成
        Dim dt = New DataTable()
        dt.Columns.AddRange(New DataColumn() {
             New DataColumn("X", GetType(Date)),
             New DataColumn("Y1", GetType(Double)),
             New DataColumn("Y2", GetType(Double))
        })
        Dim dates = New Date() {
            Date.Today, Date.Today.AddDays(1),
            Date.Today.AddDays(2),
            Date.Today.AddDays(3),
            Date.Today.AddDays(4)
        }
        dt.Rows.Add(dates(0), 1, 2)
        dt.Rows.Add(dates(0), 3, 4)
        dt.Rows.Add(dates(0), 5, 6)
        dt.Rows.Add(dates(1), 1, 5)
        dt.Rows.Add(dates(1), 3, 7)
        dt.Rows.Add(dates(1), 5, 9)
        dt.Rows.Add(dates(2), 1, 6)
        dt.Rows.Add(dates(2), 3, 8)
        dt.Rows.Add(dates(2), 5, 10)
        dt.Rows.Add(dates(3), 1, 5)
        dt.Rows.Add(dates(3), 3, 7)
        dt.Rows.Add(dates(3), 5, 9)
        dt.Rows.Add(dates(4), 1, 2)
        dt.Rows.Add(dates(4), 3, 4)
        dt.Rows.Add(dates(4), 5, 6)
        dt.AcceptChanges()

        ' 箱ひげ図の作成
        Dim boxWhisker1 = New BoxWhisker With {
            .Name = "Item1",
            .BindingX = "X",
            .Binding = "Y1",
            .QuartileCalculation = QuartileCalculation.InclusiveMedian,
            .ShowInnerPoints = True,
            .ShowOutliers = True,
            .ShowMeanLine = True,
            .ShowMeanMarks = True
        }

        Dim boxWhisker2 = New BoxWhisker With {
            .Name = "Item2",
            .BindingX = "X",
            .Binding = "Y2",
            .QuartileCalculation = QuartileCalculation.InclusiveMedian,
            .ShowInnerPoints = True,
            .ShowOutliers = True,
            .ShowMeanLine = True,
            .ShowMeanMarks = True
        }

        ' チャートの設定
        FlexChart1.DataSource = dt
        FlexChart1.Series.Clear()
        FlexChart1.Series.Add(boxWhisker1)
        FlexChart1.Series.Add(boxWhisker2)
        FlexChart1.Legend.Position = Position.Bottom

        ' 軸の設定
        FlexChart1.AxisX.Format = "MM/dd"
        FlexChart1.AxisY.Min = 0
        FlexChart1.AxisY.Max = 10
    End Sub
End Classusing C1.Chart;
using C1.Win.Chart;
namespace _20230301a
{
public partial class Form1 : Form
{
public Form1()
{
InitializeComponent();
}
private void Form1_Load(object sender, EventArgs e)
{
// データの作成
var dt = new DataTable();
dt.Columns.AddRange(new DataColumn[]{
new DataColumn("X", typeof(DateTime)),
new DataColumn("Y1", typeof(Double)),
new DataColumn("Y2", typeof(Double))
});
var dates = new DateTime[] {
DateTime.Today, DateTime.Today.AddDays(1),
DateTime.Today.AddDays(2),
DateTime.Today.AddDays(3),
DateTime.Today.AddDays(4)
};
dt.Rows.Add(dates[0], 1, 2);
dt.Rows.Add(dates[0], 3, 4);
dt.Rows.Add(dates[0], 5, 6);
dt.Rows.Add(dates[1], 1, 5);
dt.Rows.Add(dates[1], 3, 7);
dt.Rows.Add(dates[1], 5, 9);
dt.Rows.Add(dates[2], 1, 6);
dt.Rows.Add(dates[2], 3, 8);
dt.Rows.Add(dates[2], 5, 10);
dt.Rows.Add(dates[3], 1, 5);
dt.Rows.Add(dates[3], 3, 7);
dt.Rows.Add(dates[3], 5, 9);
dt.Rows.Add(dates[4], 1, 2);
dt.Rows.Add(dates[4], 3, 4);
dt.Rows.Add(dates[4], 5, 6);
dt.AcceptChanges();
// 箱ひげ図の作成
var boxWhisker1 = new BoxWhisker {
Name = "Item1",
BindingX = "X",
Binding = "Y1",
QuartileCalculation = QuartileCalculation.InclusiveMedian,
ShowInnerPoints = true,
ShowOutliers = true,
ShowMeanLine = true,
ShowMeanMarks = true
};
var boxWhisker2 = new BoxWhisker {
Name = "Item2",
BindingX = "X",
Binding = "Y2",
QuartileCalculation = QuartileCalculation.InclusiveMedian,
ShowInnerPoints = true,
ShowOutliers = true,
ShowMeanLine = true,
ShowMeanMarks = true
};
// チャートの設定
flexChart1.DataSource = dt;
flexChart1.Series.Clear();
flexChart1.Series.Add(boxWhisker1);
flexChart1.Series.Add(boxWhisker2);
flexChart1.Legend.Position = Position.Bottom;
// 軸の設定
flexChart1.AxisX.Format = "MM/dd";
flexChart1.AxisY.Min = 0;
flexChart1.AxisY.Max = 10;
}
}