作成日: 2021/04/16 最終更新日: 2021/04/16
文書種別
使用方法
詳細
カスタムパレットを使用すると、縦棒グラフや横棒グラフの棒の色を、シリーズごとに個別に指定することができます。
※この場合、棒と枠線の色は同じになります。
※この場合、棒と枠線の色は同じになります。
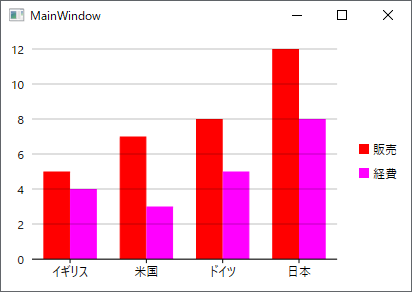
【XAML】
<Window x:Class="FlexChartLineSymbol.MainWindow"
        xmlns="http://schemas.microsoft.com/winfx/2006/xaml/presentation"
        xmlns:x="http://schemas.microsoft.com/winfx/2006/xaml"
        xmlns:d="http://schemas.microsoft.com/expression/blend/2008"
        xmlns:mc="http://schemas.openxmlformats.org/markup-compatibility/2006"
        xmlns:c1="http://schemas.componentone.com/winfx/2006/xaml"
        xmlns:local="clr-namespace:FlexChartLineSymbol"
        mc:Ignorable="d"
        DataContext = "{Binding RelativeSource={RelativeSource Mode=Self}}"
        Title="MainWindow" Height="450" Width="800">
    <Grid>
        <c1:C1FlexChart x:Name="flexChart" ItemsSource="{Binding DataContext.Data}">
        </c1:C1FlexChart>
    </Grid>
</Window>using C1.Chart;
using C1.WPF.Chart;
namespace FlexChartLineSymbol
{
public partial class MainWindow : Window
{
private List<DataItem> _data;
public MainWindow()
{
InitializeComponent();
// DataContextを使用する例(ItemsSourceはXAMLで設定済)
// チャートタイプとX軸のバインドを設定
flexChart.ChartType = ChartType.Column;
flexChart.BindingX = "Country";
// (1)カスタムパレットを使用する方法:棒と枠線の色は同じ
flexChart.Palette = Palette.Custom;
flexChart.CustomPalette = new List<Brush>()
{
new SolidColorBrush(Color.FromRgb(255, 0, 0)), // 赤
new SolidColorBrush(Color.FromRgb(255, 0, 255)), // 紫
};
flexChart.Series.Add(new Series()
{
Binding = "Sales",
SeriesName = "販売",
});
flexChart.Series.Add(new Series()
{
Binding = "Expenses",
SeriesName = "経費",
});
}
public List<DataItem> Data
{
get
{
if (_data == null)
{
_data = DataCreator.CreateData();
}
return _data;
}
}
class DataCreator
{
public static List<DataItem> CreateData()
{
var data = new List<DataItem>();
data.Add(new DataItem("イギリス", 5, 4));
data.Add(new DataItem("米国", 7, 3));
data.Add(new DataItem("ドイツ", 8, 5));
data.Add(new DataItem("日本", 12, 8));
return data;
}
}
public class DataItem
{
public DataItem(string country, int sales, int expenses)
{
Country = country;
Sales = sales;
Expenses = expenses;
}
public string Country { get; set; }
public int Sales { get; set; }
public int Expenses { get; set; }
}
}
}
また、カスタムパレットの代わりに、シリーズのStyleのStrokeおよびFillプロパティを個別に指定すると、棒および棒の周り(枠線)の色を別々に設定することが可能です。
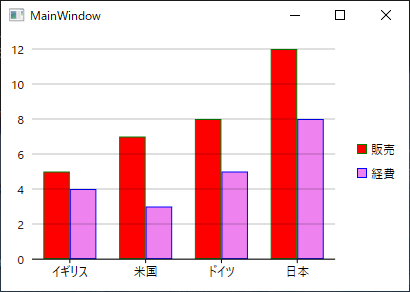
上記コードの「(1)カスタムパレットを使用」のコードを次のように置き換えて、動作をご確認ください。
            // (2)シリーズごとに直接色を設定する方法 : 棒と枠線の色を別々に設定
            flexChart.Series.Add(new Series()
            {
                Binding = "Sales",
                SeriesName = "販売",
                Style = new ChartStyle()
                {
                    Stroke = Brushes.Green,
                    Fill = Brushes.Red,
                },
            });
            flexChart.Series.Add(new Series()
            {
                Binding = "Expenses",
                SeriesName = "経費",
                Style = new ChartStyle()
                {
                    Stroke = Brushes.Blue,
                    Fill = Brushes.Violet,
                },
            });